
03-14 Happy Pi Day!
We Lending Scientists will laugh a deep rumbling chortle, enough to jostle our pocket-protectors and slide rules, from ANY math pun.
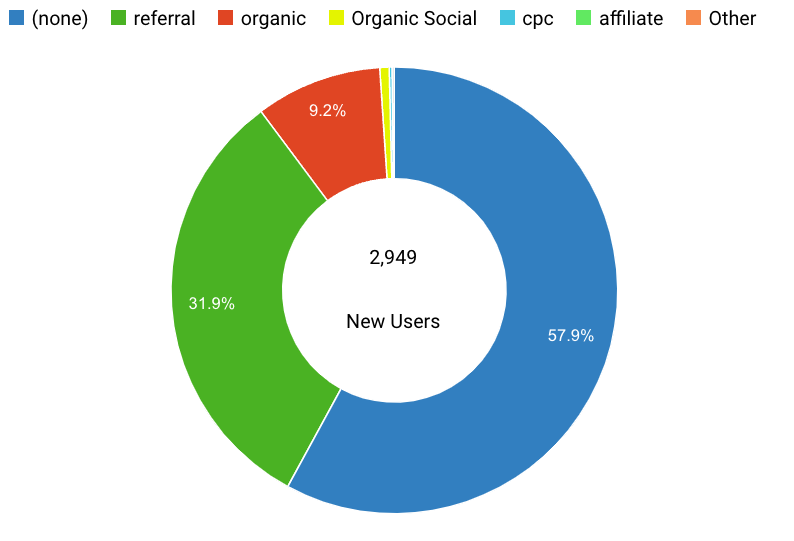
So, how precisely are we to pass up the opportunity to celebrate everyone’s favorite data visualization, the Pi (π, like the Greek letter corresponding to the ratio of a circle’s circumference to its diameter), er… “Pie chart” (or it’s even more interesting version, as far as this author is concerned) — the donut chart.
What could be more appropriate than naming a circle-shaped food after the Greek letter that has traditionally defined the nature of being a circle? Whether you’re needing to visualize the relative percentages of the sources of your web referral traffic, percentages of your budget spent on X, Y or Z, and any other part of a whole — the pie chart is your go-to data viz of choice.
And what could be more fun than dedicating a whole entire holiday on the day that corresponds to that approximate value (3.14… or March 14th) every year to eating round food named pie, after the Greek letter π (pi) which has lent its name since antiquity to defining the shape of all round things?
Do numbers mean a lot to you? Numbers translate into better KPIs, ROI and ROAS & ROMI for your campaigns. If you’re ready to take the plunge with a partner that can risk/response/performance optimize your ad campaigns.
Pie charts…
https://en.wikipedia.org/wiki/Pie_chart
Why???
Product Categories: Agency Services, Analytics, Automotive Leads, Direct Mail, Display Advertising, Education Leads, Graphic Design, Healthcare Leads, Home Services Leads, Insurance Leads, Lead Generation, Lead Management Software, Lead Scoring, Lead Verification, Marketing Technology, Mobile, Mobile Marketing, Mortgage Leads, Pay Day Lending Leads, Solar Leads
Visit us in booth 700